The three financial statements, explained
Every company publishes three financial statements, and each answers a different question. Here's what the balance sheet, income statement and cash flow statement actually show, how they link together, and which investing metrics come from each.
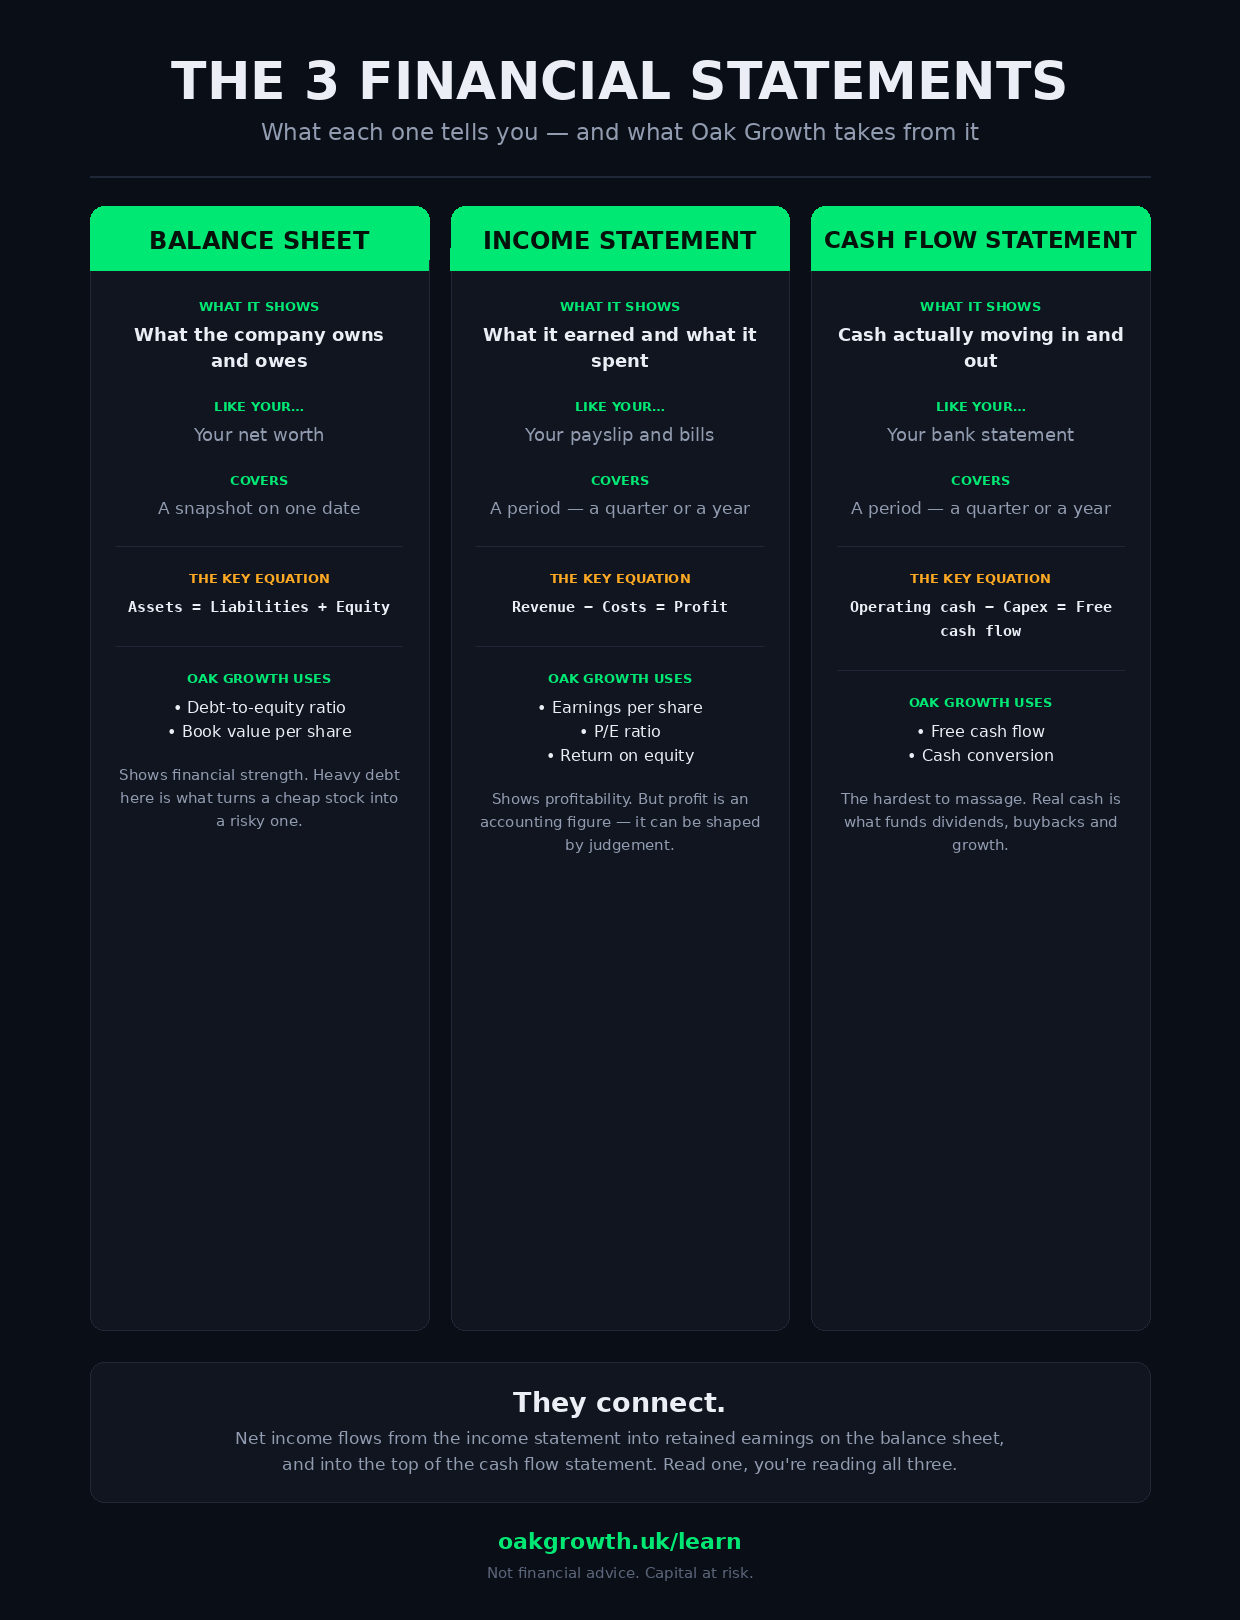
The three statements at a glance — what each shows and which metrics come from it.
Why there are three
A single number can’t describe a business. A company can be profitable and still run out of cash. It can hold valuable assets and still be drowning in debt. It can generate plenty of cash while its profits fall. Each statement answers a different question, and you need all three to see the whole picture.
The balance sheet — what it owns and owes
A snapshot on a single date, showing assets on one side and liabilities plus equity on the other. It always balances, because everything a company owns was funded either by borrowing or by its owners:
Think of it as the company’s net worth. It tells you how much debt the business carries, how much cash it holds, and what the shareholders’ stake is worth on paper. For a value investor it answers one blunt question: could this business survive a bad year?
Full guide to reading a balance sheet →
The income statement — what it earned and spent
Also called the profit and loss, or P&L. Unlike the balance sheet it covers a period — a quarter or a year — and works down from revenue to profit:
It shows whether the business makes money and how efficiently. From it come earnings per share, the price-to-earnings ratio and return on equity — three of the most widely used measures in investing.
One caution: profit is an accounting figure. It involves judgement about when revenue is recognised, how assets are depreciated and what gets treated as a cost. Two honest companies can report different profits from identical trading. That’s not fraud; it’s accounting.
Full guide to reading an income statement →
The cash flow statement — what actually moved
The one that strips out the judgement. It tracks real money moving in and out across the same period, split into operating, investing and financing activities. The figure value investors care about most is what’s left after the business has paid to maintain itself:
Free cash flow is what actually funds dividends, buybacks, debt repayment and growth. It’s also far harder to flatter than profit, which is why it carries so much weight in a valuation.
Full guide to reading a cash flow statement →
How the three connect
They aren’t separate documents — they’re three views of the same business, and they link mechanically:
Income statement → balance sheet
Net income flows into retained earnings, increasing shareholders’ equity. Profits the company keeps become part of what it owns.
Income statement → cash flow statement
Net income is the starting line of the cash flow statement. Non-cash items are then added back and working-capital changes applied, to get from accounting profit to actual cash.
Cash flow statement → balance sheet
The closing cash balance becomes the cash figure on the balance sheet. The circle closes.
Once you see the links, reading one statement tells you what to expect in the others — and when they disagree, that disagreement is usually the most interesting thing in the accounts.
What a value investor takes from each
Every metric in a serious valuation traces back to one of these three statements. Debt-to-equity and book value come from the balance sheet. Earnings per share, the P/E ratio and return on equity come from the income statement. Free cash flow comes from the cash flow statement — and that’s the figure a discounted cash flow valuation is built on.
Put simply: the income statement tells you if it’s profitable, the balance sheet tells you if it’s safe, and the cash flow statement tells you if the profits are real.
See these numbers already read for you
Oak Growth pulls the key figures from all three statements for 1,000+ US, UK and European companies — and turns them into a single view of quality and value.
Explore Oak GrowthCommon questions
What are the three financial statements?
The balance sheet, the income statement and the cash flow statement. The balance sheet shows what a company owns and owes at a point in time; the income statement shows what it earned and spent over a period; the cash flow statement shows cash actually moving in and out over that period.
How do the three financial statements connect?
Net income from the income statement flows into retained earnings on the balance sheet, and forms the starting line of the cash flow statement. The closing cash balance on the cash flow statement appears as cash on the balance sheet. They describe the same business from three angles.
Which financial statement is most important?
It depends what you're judging. The income statement shows profitability, the balance sheet shows financial strength, and the cash flow statement shows whether the profits are real cash. Value investors often weight cash flow most heavily because it is the hardest of the three to flatter.
What is the difference between profit and cash flow?
Profit is an accounting figure that includes non-cash items and timing judgements. Cash flow tracks money actually moving. A company can report a profit while burning cash, which is why both are worth reading.